CRIME RATES AND AIRBNB RENTALS IN NYC
- Adi Arifovic, Drew Bowser, Hannah Gustafson
What is this about?
AirBnb: online website for renting and offering lodging for long-term rentals, business trips, vacations for tourists, etc. AirBnb does not personally own any of the rentals put on the site, but rather creates a marketplace for the bookings and receives a commission for each rental completed.
Arrest: Crime is an important component and consideration of many people when considering which to live (especially if they have children). Low arrest and crime rates generally create for a much safer neighborhood.
Question of Interest
How do crime rates in New York City affect AirBnb listing types and prices in Manhattan neighborhoods and NYC boroughs?
- Do neighborhoods with high crime rates lead to an overall lower average of Airbnb prices?
- Do higher crime rates lead to rentals in certain neighborhoods being listed as available for more days (on average) throughout the year?
Why do we care?
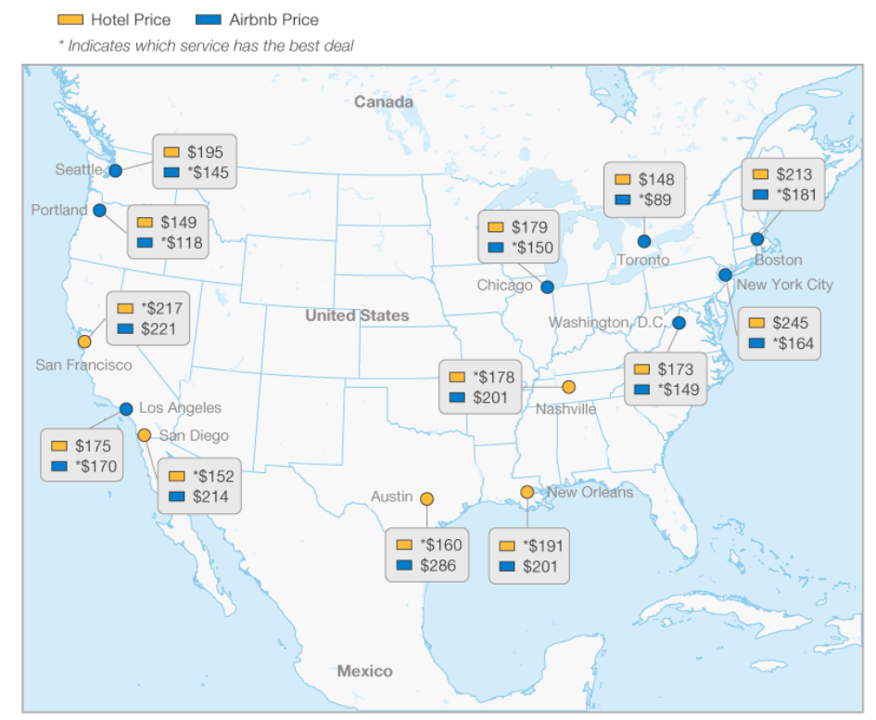
AirBnb prices are typically cheaper than hotels in New York City which is different compared to some other major cities like San Diego, CA and Austin, TX.
Cheaper option for many people looking for short-term and especially long term stays in New York.
Consumers can see the average price someone might pay for a similar AirBnb listing in the same neighborhood.
AirBnb owners can see how crime rates in their area might be affecting the price someone is willing to pay.
From this, we can learn how crime rates might possibly dissuade people from renting based on price and the number of available apartments in a given year.
Data
AirBnb: The data was found on (insideairbnb.com/get-the-data) and is updated monthly with data. We used data from September of 2015 - September of 2019.
Crime and Arrests: This data ( was found using NYC OpenData where it is an open and live data set about arrests. This data shows all the arrests in New York City and its boroughs (Bronx, Brooklyn, Queens, etc.) and is broken down every quarter. The records show information about date, time, type of crime, the location, and a couple of other interesting facets like perpetrator race and age. We combined two data sets from the current year and historic data that covers 2006-2019. (https://data.cityofnewyork.us/Public-Safety/NYPD-Arrest-Data-Year-to-Date-/uip8-fykc) and (https://data.cityofnewyork.us/Public-Safety/NYPD-Arrests-Data-Historic-/8h9b-rp9u)
Code and Plots
AirBnb Prices by Neighbourhood
library(ggplot2)
AllListings <- rbind(Listings2015, Listings2016, Listings2017, Listings2018, Listings2019)
unique(AllListings)

## # A tibble: 190,790 x 7
##        id neighbourhood latitude longitude room_type price availability_365
##     <dbl> <chr>            <dbl>     <dbl> <chr>     <dbl>            <dbl>
##  1 3.94e6 City Island       40.8     -73.8 Private ~    65              341
##  2 8.01e6 City Island       40.8     -73.8 Private ~    75              352
##  3 4.62e6 City Island       40.9     -73.8 Entire h~   115              243
##  4 9.58e5 City Island       40.9     -73.8 Entire h~    93              298
##  5 1.89e6 City Island       40.8     -73.8 Entire h~   300              271
##  6 5.56e6 City Island       40.9     -73.8 Private ~    49              337
##  7 3.36e6 City Island       40.8     -73.8 Private ~    60              326
##  8 6.63e6 City Island       40.8     -73.8 Entire h~   125              325
##  9 8.00e6 Allerton          40.9     -73.9 Private ~    45              341
## 10 4.46e6 Allerton          40.9     -73.9 Private ~    55              316
## # ... with 190,780 more rows

AllListingsAvgPrice <- AllListings %>%
  group_by(neighbourhood) %>%
  summarize(avgprice = mean(price), avgavail = mean(availability_365)) %>%
  arrange(desc(avgavail))

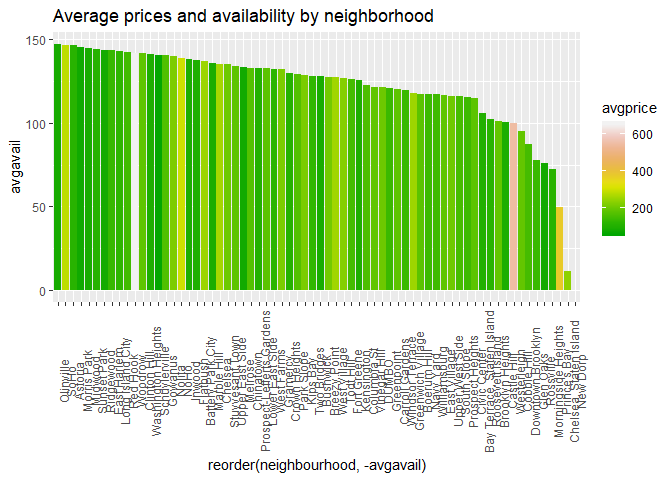
NeighbourhoodPrice <-ggplot(slice(AllListingsAvgPrice, 1:70), aes(x=reorder(neighbourhood, -avgavail), y=avgavail, fill=avgprice)) +
  geom_bar(stat="identity") + theme(axis.text.x = element_text(angle = 90)) + scale_fill_gradientn(colours = terrain.colors(10)) + ggtitle("Average prices and availability by neighborhood")
NeighbourhoodPrice
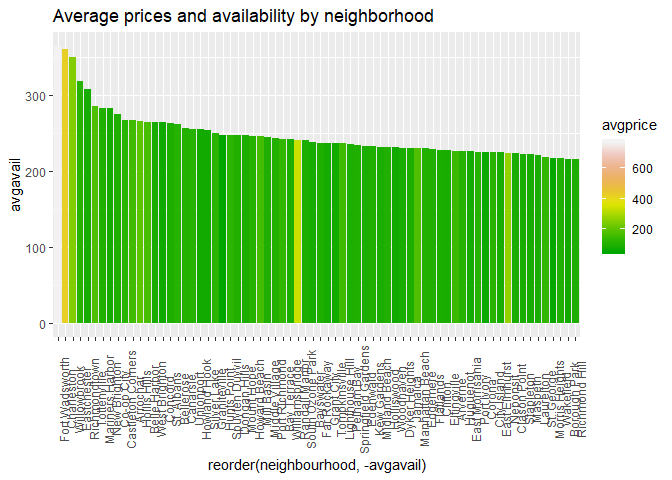
NeighbourhoodPrice2 <-ggplot(slice(AllListingsAvgPrice, 71:160), aes(x=reorder(neighbourhood, -avgavail), y=avgavail, fill=avgprice)) +
  geom_bar(stat="identity") + theme(axis.text.x = element_text(angle = 90)) + scale_fill_gradientn(colours = terrain.colors(10)) + ggtitle("Average prices and availability by neighborhood")
NeighbourhoodPrice2
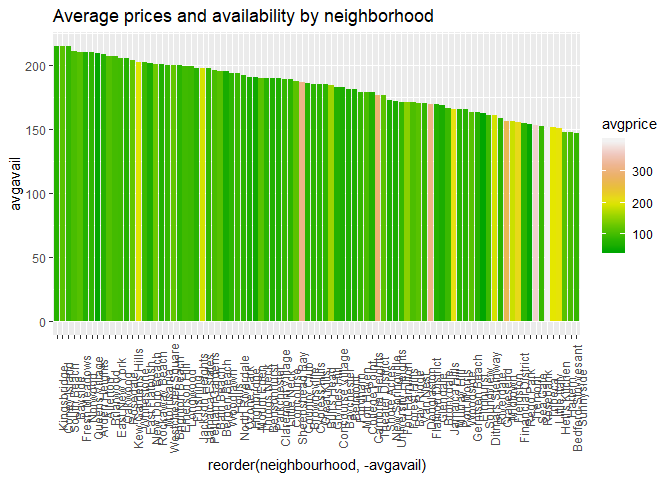
NeighbourhoodPrice3 <-ggplot(slice(AllListingsAvgPrice, 161:228), aes(x=reorder(neighbourhood, -avgavail), y=avgavail, fill=avgprice)) +
  geom_bar(stat="identity") + theme(axis.text.x = element_text(angle = 90)) + scale_fill_gradientn(colours = terrain.colors(10)) + ggtitle("Average prices and availability by neighborhood")
NeighbourhoodPrice3
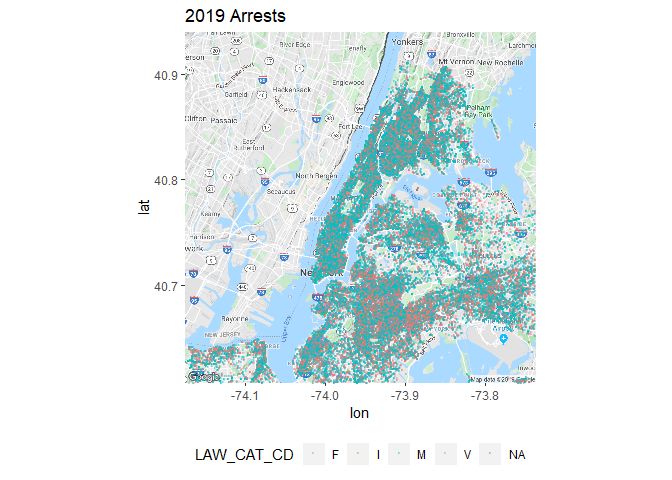
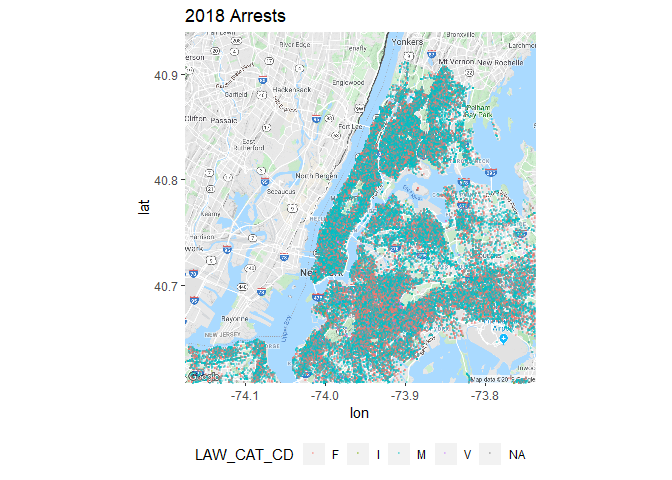
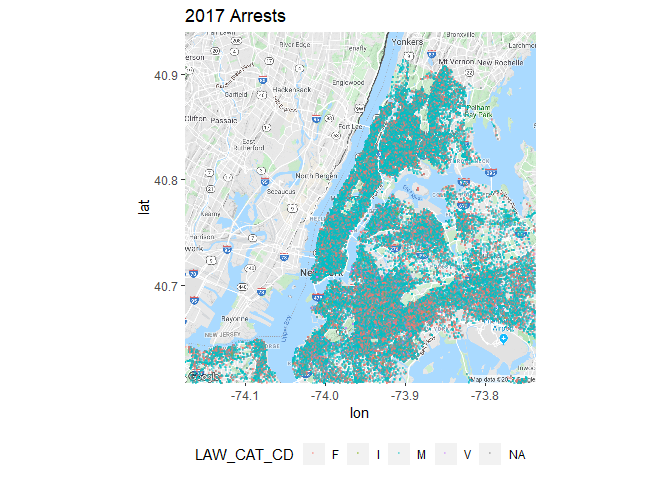
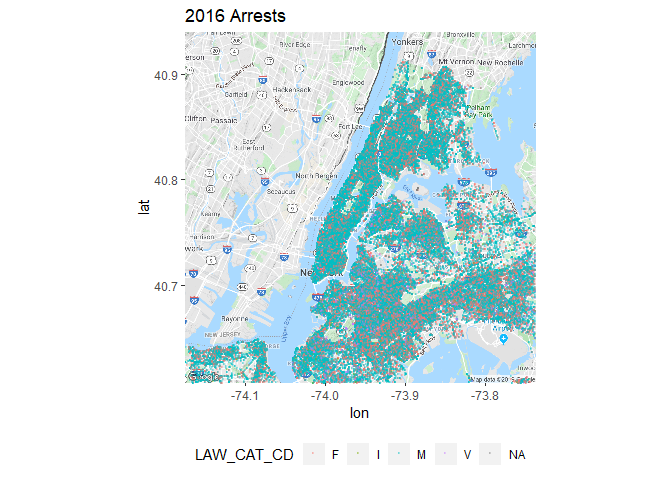
Geographic View of the Arrests in NYC and its Boroughs by Year:
## [1] TRUE
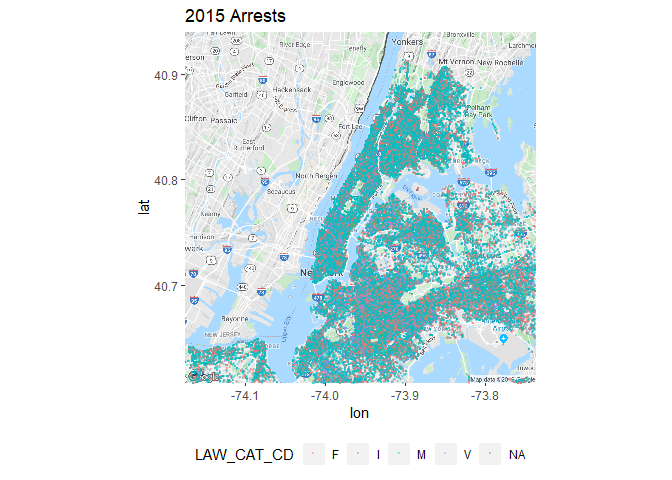
Geographic View of Felony Arrests in NYC and its Boroughs by Year:
## Source : https://maps.googleapis.com/maps/api/geocode/json?address=Upper+East+Side&key=xxx

## Source : https://maps.googleapis.com/maps/api/staticmap?center=40.773565,-73.956555&zoom=11&size=640x640&scale=2&maptype=terrain&language=en-EN&key=xxx

## Warning: Removed 4602 rows containing missing values (geom_point).

## Source : https://maps.googleapis.com/maps/api/geocode/json?address=Upper+East+Side&key=xxx
## Source : https://maps.googleapis.com/maps/api/staticmap?center=40.773565,-73.956555&zoom=11&size=640x640&scale=2&maptype=terrain&language=en-EN&key=xxx

## Warning: Removed 6138 rows containing missing values (geom_point).

## Source : https://maps.googleapis.com/maps/api/geocode/json?address=Upper+East+Side&key=xxx
## Source : https://maps.googleapis.com/maps/api/staticmap?center=40.773565,-73.956555&zoom=11&size=640x640&scale=2&maptype=terrain&language=en-EN&key=xxx

## Warning: Removed 6491 rows containing missing values (geom_point).

## Source : https://maps.googleapis.com/maps/api/geocode/json?address=Upper+East+Side&key=xxx
## Source : https://maps.googleapis.com/maps/api/staticmap?center=40.773565,-73.956555&zoom=11&size=640x640&scale=2&maptype=terrain&language=en-EN&key=xxx

## Warning: Removed 6716 rows containing missing values (geom_point).

## Source : https://maps.googleapis.com/maps/api/geocode/json?address=Upper+East+Side&key=xxx
## Source : https://maps.googleapis.com/maps/api/staticmap?center=40.773565,-73.956555&zoom=11&size=640x640&scale=2&maptype=terrain&language=en-EN&key=xxx

## Warning: Removed 6980 rows containing missing values (geom_point).

Geographic View of Misdemeanor Arrests in NYC and its Boroughs by Year:
#2019
ArrestData2019F <- ArrestDataYear %>%
  filter(ARRESTDATE == 2019, LAW_CAT_CD == "M")


p2019.2 <- ggmap(get_map(geocode("Upper East Side")
                   , zoom = 11
                   , maptype = "terrain"
                   , color = "color"))

## Source : https://maps.googleapis.com/maps/api/geocode/json?address=Upper+East+Side&key=xxx

## Source : https://maps.googleapis.com/maps/api/staticmap?center=40.773565,-73.956555&zoom=11&size=640x640&scale=2&maptype=terrain&language=en-EN&key=xxx

p2019.2 + geom_point(aes(x = Longitude, y = Latitude,  colour = LAW_CAT_CD), data = ArrestData2019F, size = 1.5, alpha=0.5) +
  theme(legend.position="bottom")

## Warning: Removed 6476 rows containing missing values (geom_point).

#2018
ArrestData2018F <- ArrestDataYear %>%
  filter(ARRESTDATE == 2018, LAW_CAT_CD == "M")


p2018.2 <- ggmap(get_map(geocode("Upper East Side")
                   , zoom = 11
                   , maptype = "terrain"
                   , color = "color"))

## Source : https://maps.googleapis.com/maps/api/geocode/json?address=Upper+East+Side&key=xxx
## Source : https://maps.googleapis.com/maps/api/staticmap?center=40.773565,-73.956555&zoom=11&size=640x640&scale=2&maptype=terrain&language=en-EN&key=xxx

p2018.2 + geom_point(aes(x = Longitude, y = Latitude,  colour = LAW_CAT_CD), data = ArrestData2018F, size = 1.5, alpha=0.5) +
  theme(legend.position="bottom")

## Warning: Removed 9974 rows containing missing values (geom_point).

#2017
ArrestData2017F <- ArrestDataYear %>%
  filter(ARRESTDATE == 2017, LAW_CAT_CD == "M")


p2017.2 <- ggmap(get_map(geocode("Upper East Side")
                   , zoom = 11
                   , maptype = "terrain"
                   , color = "color"))

## Source : https://maps.googleapis.com/maps/api/geocode/json?address=Upper+East+Side&key=xxx
## Source : https://maps.googleapis.com/maps/api/staticmap?center=40.773565,-73.956555&zoom=11&size=640x640&scale=2&maptype=terrain&language=en-EN&key=xxx

p2017.2 + geom_point(aes(x = Longitude, y = Latitude,  colour = LAW_CAT_CD), data = ArrestData2017F, size = 1.5, alpha=0.5) +
  theme(legend.position="bottom")

## Warning: Removed 11697 rows containing missing values (geom_point).

#2016
ArrestData2016F <- ArrestDataYear %>%
  filter(ARRESTDATE == 2016, LAW_CAT_CD == "M")


p2016.2 <- ggmap(get_map(geocode("Upper East Side")
                   , zoom = 11
                   , maptype = "terrain"
                   , color = "color"))

## Source : https://maps.googleapis.com/maps/api/geocode/json?address=Upper+East+Side&key=xxx
## Source : https://maps.googleapis.com/maps/api/staticmap?center=40.773565,-73.956555&zoom=11&size=640x640&scale=2&maptype=terrain&language=en-EN&key=xxx

p2016.2 + geom_point(aes(x = Longitude, y = Latitude,  colour = LAW_CAT_CD), data = ArrestData2016F, size = 1.5, alpha=0.5) +
  theme(legend.position="bottom")

## Warning: Removed 12350 rows containing missing values (geom_point).

#2015
ArrestData2015F <- ArrestDataYear %>%
  filter(ARRESTDATE == 2015, LAW_CAT_CD == "M")


p2015.2 <- ggmap(get_map(geocode("Upper East Side")
                   , zoom = 11
                   , maptype = "terrain"
                   , color = "color"))

## Source : https://maps.googleapis.com/maps/api/geocode/json?address=Upper+East+Side&key=xxx
## Source : https://maps.googleapis.com/maps/api/staticmap?center=40.773565,-73.956555&zoom=11&size=640x640&scale=2&maptype=terrain&language=en-EN&key=xxx

p2015.2 + geom_point(aes(x = Longitude, y = Latitude,  colour = LAW_CAT_CD), data = ArrestData2015F, size = 1.5, alpha=0.5) +
  theme(legend.position="bottom")

## Warning: Removed 12074 rows containing missing values (geom_point).

Analysis of Graphs and Data
Looking at the graphs, there are far more felonies committed in 2019 than in past years. Furthermore, there are more felonies committed in Brooklyn, speficically Bedford-Stuyvestant and Ridgewood and areas surrounding Highland Park, compared to Manhattan and the Bronx as a whole. There are a lot of misdemeanors committed in Manhattan and are more concentrated in lower Manhattan than on the Upper East and Upper West sides. This trend is consistent through the 2016-2019 data. However, in 2016 there are very few felonies committed in Manhattan and far fewer than in recent years. There is a relatively similar concentration of point and occurences across all locations and years. In 2015, there were less felonies across all locations overall.
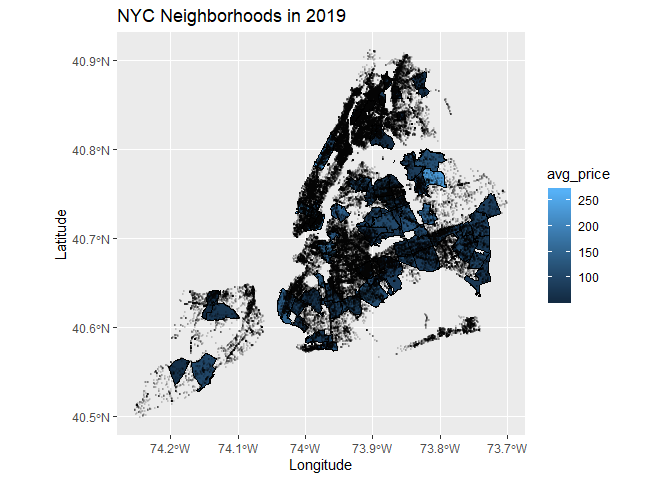
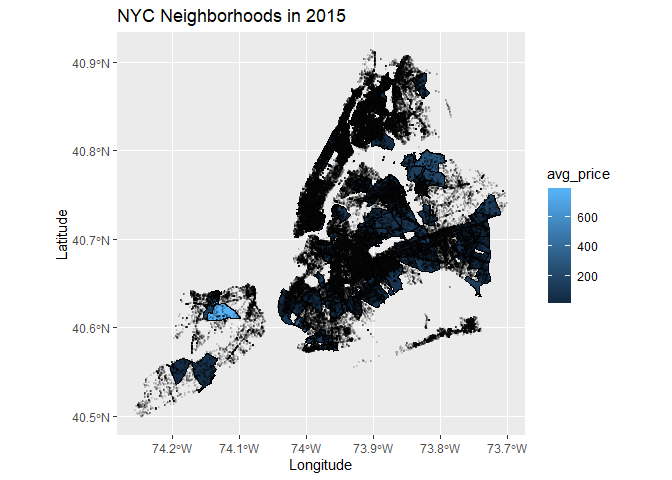
We only included 2015 and 2019 years here as there was not much change in the pattern over the years considered in the project.
Significant Observations
Murray Hill had an average price of 229 dollars and low crime rates. Whereas, a neighbourhood right next to it had an average price of 98 dollars but much higher crime rates. However, the average availability of apartments was relatively similar with only a difference of about 15 days. Clinton Hill had an average price of 182 and low crime rates. Whereas, Brownsville, a neighbourhood in close approximation to it, had an average price of 78 dollars but much higher crime rates. In addition, the average availability for Clinton Hill was 95 days whereas the average availability for Brownsville was 114 days.
## Warning: sf layer has inconsistent datum (+proj=longlat +ellps=WGS84 +no_defs).
## Need '+proj=longlat +datum=WGS84'

## Warning in pal(c(r[1], cuts, r[2])): Some values were outside the color
## scale and will be treated as NA
## Warning: sf layer has inconsistent datum (+proj=longlat +ellps=WGS84 +no_defs).
## Need '+proj=longlat +datum=WGS84'

## Warning: Some values were outside the color scale and will be treated as NA
Conclusion
Do neighborhoods with high crime rates lead to an overall lower average of Airbnb prices? Murray Hill: $229 + low crime rates vs. Flushing: $98
- high crime rates Clinton Hill: $182 + low crime rates vs. Brownsville: $78 + high crime rates
Do higher crime rates lead to rentals in certain neighborhoods being listed as available for more days (on average) throughout the year? Murray Hill vs. Flushing → Relatively similar, only a difference of approx. 15 days. Clinton Hill: 95 days vs. Brownsville: 114 day
Important Findings: Location appears to be the primary factor that determines listing prices. This can be seen through the prices of all of Manhattan, which has high crime rates throughout almost all the districts, but yet still has high AirBnB listing prices. Within Manhattan there are still significant differences in listing prices in burroughs that have different crime rates. West Village: $267 + low crime rates vs. East Village: $186 + high crime rates
Limitations
What are the limitations of your work? Pairing neighbourhoods with districts → we were unable to successfully pair all neighbourhoods to districts, which left some areas without their arrest history or past AirBnB listings.
To what population do your results apply? Do they generalize? Our results apply to the New York population. The results cannot be generalized to a whole population as it was specific to New York;however, we can now say that as amount of crimes committed in an area increase, it is highly likely that AirBnB listing prices will decrease in that area.
Could your work be extended with more data or computational power or time to analyze? How could your study be improved? Suggesting plausible extensions doesn’t weaken your work – it strengthens it by connecting it to future work. Our work could be extended by comparing more AirBnB listings and crime rates in cities other than New York, and see how the relationship between them varies in different cities, especially considering NYC AirBnb prices are typically lower than hotel prices on average.